Anton Simon M Palo, Mercedita A Rosetes, Donna P Cariño
Foodlink Advocacy Co-operative, the Philippines
7.1 Abstract
This assessment examines the impacts of the COVID-19 pandemic on the Philippines’ food security using a supply-chain approach. The National Capital Region (NCR) (also known as Metro Manila) is the focus, as it is acknowledged to have incurred both the greatest health impact from COVID-19 and critical supply-chain disruption in terms of food demand and consumption. The assessment explores four key food commodity chains (rice, pork, cabbage and Lakatan banana), the impact of the pandemic on the production, distribution and demand for those commodities and the interaction of COVID-19 with other external shocks and pre-existing sensitivities.
Four key themes regarding exposure and impacts emerged:
Other external drivers were playing a more significant role in food availability across the four food commodity chains than COVID-19.
Local enforcement of transport restrictions is creating supply-chain bottlenecks, particularly for production inputs and produce distribution.
Consumer and retail components of the food commodity chains have been significantly affected by enforced community quarantine.
Despite the large number of women engaged along these food commodity chains, there has been no targeted response designed to support them, particularly in the processing and retail segments.
Opportunities for short-term measures include:
exploring other food commodity chains and locations
addressing knowledge gaps that have arisen from the assessment
encouraging innovative synergies between producers and consumer segments
realigning government recovery funds to support food security.
Opportunities for intermediate- and longer-term measures include:
improving coordination systems for food logistics
improving the efficiency and flexibility of value chains
exploring and mainstreaming mechanisms with which agriculture can support inclusive social protection
exploring processing and storage to address food waste
developing national food security infrastructure such as food depots that incorporate aspects of food availability, access and utilisation.
7.2 COVID-19 in the Philippines
7.2.1 Country overview (July 2020)
Image
* The assessment reports 26,420 known cases and 1,098 recorded deaths at 15 June 2020, reflecting the situation at the time of core aspects of the research.
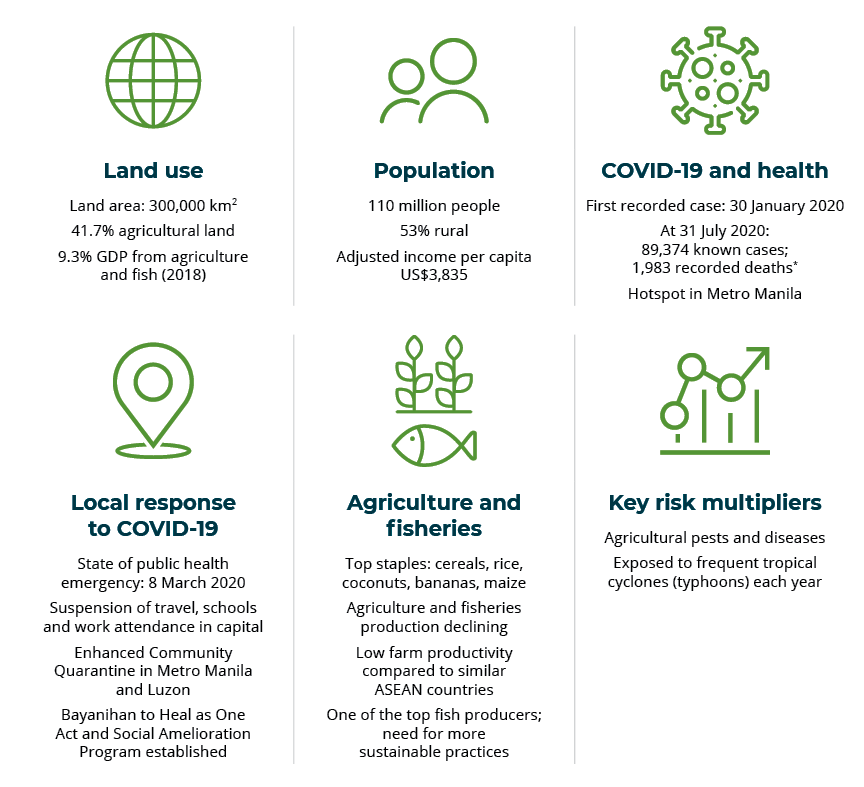
7.2.2 Development context
The Philippines is home to an estimated 110 million people who inhabit 7,641 islands. It has enjoyed a period of rapid economic growth, with an average rate of 6.3% from 2010 to 2018 (World Bank 2020a). The benefits of this rapid growth include significant reduction in poverty, from 23.5% in 2015 to 16.7% in 2018, despite an increase in the poverty criteria threshold from 22,747 Philippine pesos (PHP) (US$455) per capita in 2015 to PHP25,813 (US$516) per capita in 2018. The incidence of food poor has also dropped from 9.1% in 2015 to 5.2% in 2018 (PSA 2020a). An overview of Philippine agricultural, fisheries and nutrition context is provided in Table 7.1.
Collectively, the country’s agriculture, forestry and fisheries sectors have shown a steady decline in contribution to gross domestic product from 12.7% in 2010 to 9.3% in 2018 (World Bank 2020a). According to Dy (2017), this decline is the result of a continued primary focus on domestic markets; an export base that is primarily focused on coconuts (which is experiencing a decline in global market value due to increased palm oil production) and Cavendish bananas (a relatively new product, primarily operated by large private companies); and generally small landholdings (an average of 1 ha per farmer). Citing United States Department of Agriculture Economic Research Service Data, Dy (2019) also shows lagging farm productivity, with an average total factor productivity rating of 1.87 (2001–13) compared to similar ASEAN countries, which ranged from 2.22 to 2.85.
Agricultural productivity and associated livelihoods are highly variable across the Philippines. Poverty incidence provides an indirect indicator of this heterogeneity. The incidence of poverty in the NCR—a cluster of highly urbanised cities—is 2.2%. In the more rural settings of Luzon, Visayas and Mindanao, poverty incidence ranges from 11.4% to 31.6%.
Table 7.1 Agricultural, fisheries and nutrition context of the Philippines
Sustainable Development Goal Indicator 2.1.2: Prevalence of moderate or severe food insecurity in the populationb
percentage of total population
52.5
2017 World Risk Index (mean value calculation 2012–2016)e
out of 171
3
World Bank (2020b)
FAO (2020)
Global Nutrition Report (2020)
UNDP (2020)
Bündnis Entwicklung Hilft (2017)
Data collated on 10 July 2020 by Alex van der Meer Simo.
7.2.3 Status of COVID-19 in the Philippines
As of 15 June 2020, there were 26,420 confirmed cases of COVID-19 in the Philippines and 1,098 deaths (GOV.PH 2020). The national COVID-19 situation is coordinated by the Inter-Agency Task Force for the Management of Emerging Infectious Diseases (IATF).
The first local positive case was detected by the Department of Health on 30 January 2020, coinciding with a declaration from the World Health Organization (WHO) elevating COVID-19 to a global public health emergency. Between February and March 2020, much of the Philippine government efforts were focused on establishing and enforcing border closures and domestic travel restrictions.
The following timeline highlights the rapid development of a national COVID-19 response:
7 March 2020: Department of Health confirmed the first case of local transmission, leading to a declaration of a state of public health emergency across the country the following day. This included announcements on the suspension of school activities, prohibition on mass gatherings (church activities, social events, etc.) and request for changes to working arrangements encouraging more working from home.
12 March 2020: Identifying a sudden increase in local transmissions and the WHO declaration of COVID-19 as a global pandemic, the IATF increased the alert status to Code Red sub-level 2 and announced intentions to impose a community quarantine on NCR to start on 15 March 2020.
15 March 2020: Air, sea, and land travel was suspended into and out of NCR.
17 March 2020: President Duterte declared that NCR and the entire Luzon island would be under enhanced community quarantine, effectively suspending work outside of healthcare, food processing and food distribution. Initially, the enhanced community quarantine was scheduled to end on 12 April 2020, but it was extended twice and continued until 1 June 2020. For the rest of the country, enhanced community quarantine was imposed upon recommendation by local government units and/or the Department of Health via the IATF.
25 March 2020: The Bayanihan to Heal as One Act (RA No. 11469) was signed by President Duterte. RA 11469 provides the president (and IATF) the ability to quickly respond to the rapidly growing case numbers and concerns regarding ineffective community quarantine. These include:
implementation and enforcement of community quarantine rules
release of subsidies to low-income households via the Social Amelioration Program
permission for local government units to use more than 5% of their existing Calamity Funds[2]
ensuring availability of basic goods
strict regulation of business and consumer practices (hoarding, profiteering, etc.)
ensuring the availability of credit.
1 June 2020: Restrictions were relaxed, with most areas of the country under a general community quarantine. Although still under strict physical distancing rules, most business establishments and some public transports were allowed to operate once more. The general community quarantine was extended to the end of July 2020.
[2] The Calamity Fund – more formally known as the Local Disaster Risk Reduction and Management Fund – is a fund reserved for purposes of disaster and emergency situations and used by local government units. The fund is authorised by the 2010 Philippine Disaster Risk Reduction and Management Act (RA 10121).
7.3 Assessment approach
This assessment examines the impacts of the COVID-19 pandemic on the Philippines’ food security using a supply chain approach, applying the analytical framework described in Chapter 2. The components of the framework were operationalised using local policies and programs, and through consultations with ACIAR Philippines partners.
The NCR is the focus of the assessment, as it is acknowledged to have incurred both the greatest health impact due to COVID-19 and critical supply-chain disruptions in terms of food demand and consumption.
The assessment explores four key food commodity chains (rice, pork, cabbage and Lakatan banana) in terms of the impact of the pandemic on production, distribution and demand for these commodities and the interaction of the COVID-19 crisis with other external shocks and pre-existing sensitivities.
Given the rapid nature of the assessment, it should be viewed as snapshot of food system dynamics at the start of the pandemic—mainly between March and mid-May 2020—and may not be representative of issues and concerns across the whole of the agricultue sector or the country in general.
7.3.1 Data collection methods
The methods employed for this assessment combine a desktop literature review with structured and semi-structured interviews (focus group discussion and key informant interviews). The desktop review utilised macro-data on the Philippines and NCR data, and COVID-19 and food system–related government policies sourced from official government websites, such as the Philippine Statistics Authority and other national government agencies, released from January to mid-June 2020.
A focus group discussion and key informant interviews were conducted with 17 participants (7 women) who were confirmed to have directly and indirectly participated in the selected food chains, and who are representative of farming communities, agribusiness companies, government agencies and civil society organisations, including women’s organisations.
7.3.2 Assessment framing using food commodity chains
To reach consensus on which food system to investigate for this assessment, a three-step process was adopted:
establish a case study region that includes a high incidence of COVID-19 cases, an intersection of multiple food chains, and good availability and granularity of data
select representative food commodity chains that are traceable back to the case study region with demonstrated high utilisation, and with prioritisation among ACIAR partners
assess food security of the selected food commodity chains in terms of impact on availability, accessibility and utilisation.
Case study region
The NCR serves as the case study for the country assessment. It is home to almost 14 million individuals, or 12.7% of the country’s total population. The NCR is the seat of government and is the single largest local food market, with US$9.3 billion equivalent every year, capturing 18.5% of the total annual food expense of the country (PSA 2019).
In the Philippines, the NCR has also been hardest hit by COVID-19. As of 4 June 2020, the total number of confirmed COVID-19 patients in the NCR was 11,609 (57% of total cases in the country). The NCR has also had the most stringent application of community quarantine rules imposed since mid-March 2020.
Food commodity chain selection
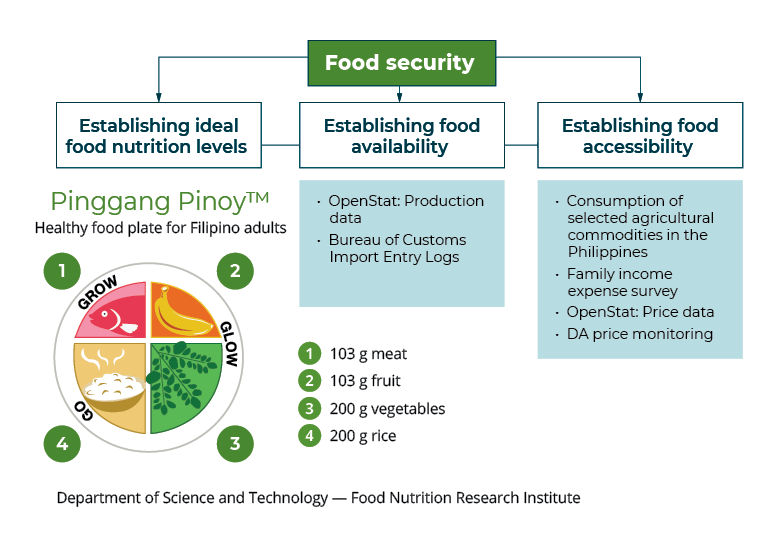
The Pinggang Pinoy (Filipino Plate) concept (Figure 7.1) was developed by the Food and Nutrition Research Institute as a way to promote an easy-to-follow healthy food proportion guide for meals (FNRI 2016). The model recommends a daily intake of 200 g of rice, 200 g of vegetables, 103 g fruit and 103 g of meat. For the purposes of this assessment, the Pinggang Pinoy model was used to identify the key food groups and highlight which value chains to examine.
The key food commodity chains include:
Rice: Rice is the main food staple in the Philippines. Key informants with direct participation for the rice food commodity chains included a farmer entrepreneur who also heads a municipal-level farmers organisation, and representatives from social enterprise.
Pork: Pork was chosen primarily to explore its interaction with the African swine fever virus that has been present in the Philippines since 2019. Pork meat is also the second most-consumed meat in NCR (PSA 2017). Key informants with direct participation in the commodity chain included representatives from agribusiness companies providing inputs and farm services to both commercial and backyard grower farms.
Cabbage: Cabbage is the highest consumed highland vegetable in NCR. It is also a priority commodity for the Philippine Council for Agriculture, Aquatic and Natural Resources Research and Development (PCAARRD) and the High Value Crops Development Program. Key informants with direct participation for the vegetable component included an agribusiness platform that performed logistics linkages in the early months of the community quarantine.
Lakatan banana: Lakatan banana is the most-consumed fruit in NCR (PSA 2017) and is also a priority crop of PCAARRD. Assessment of the interaction of COVID-19 with extreme weather events is of special interest in the banana commodity chain. Typhoon Kammuri in early December 2019 and Typhoon Vongfong in mid-May 2020 hit key banana production areas in the Quezon province. Key informants included farmer entrepreneurs and members of a banana growers association.
Image
Figure 7.1 Pinggang Pinoy: Operationalisation of the components of food security
7.4 Assessment results
7.4.1 Snapshot of key findings
Image
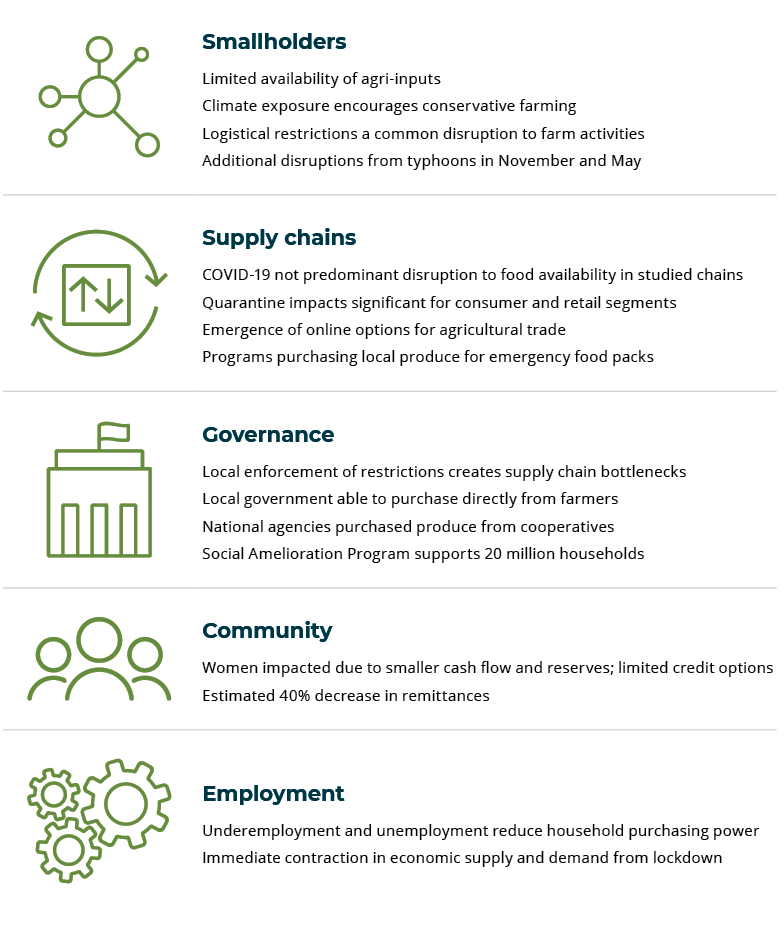
7.4.2 Exposure and impacts
This section examines how the COVID-19 crisis and the government’s response have affected Philippine food systems, as represented by the four food commodity chains. The data collected and inferences made relate specifically to the four food commodity chains that link back to markets in the NCR, and may not capture the diversity of exposures and impacts that exist across the broader Philippine agriculture sector or the country as a whole.
Four themes regarding exposure and impacts are presented here:
At this time, other external drivers are playing a more significant role in food availability across the four food commodity chains than the COVID-19 crisis.
Local enforcement of transport restrictions is creating supply-chain bottlenecks, particularly for production inputs and produce distribution.
The consumer and retail components of the food commodity chains have been significantly affected by community quarantine.
Despite the large number of women engaged along these food commodity chains, there has been no targeted response designed to support them, particularly in the processing and retail segments.
The sections below provide a more detailed account of these four exposure and impact themes.
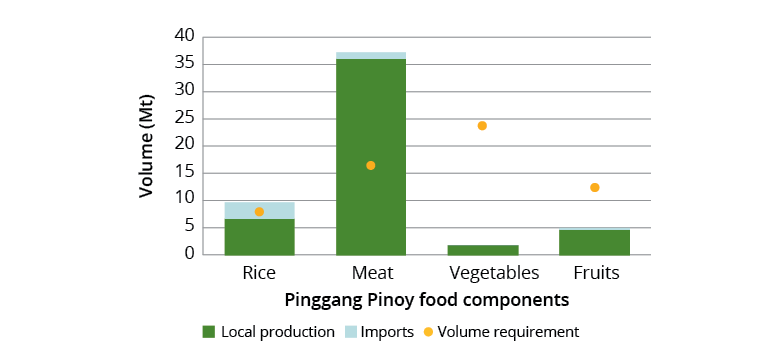
COVID-19 is not the predominant disruption to food availability
Pinggang Pinoy recommends the volume of food needed to meet nutrition requirements. Figure 7.2 provides a snapshot (quantified in 2019) of food availability from locally produced food and food imports:
Pork meat has the highest volume of locally produced commodity, achieving a 129.1% surplus against the volume requirement of the Pinggang Pinoy model.
Rice, which has been the focus of government for decades (Dy 2017), achieves 24.8% surplus after rice imports have been added.
Vegetables and fruits are significantly lower than the target recommended by Pinggang Pinoy, with shortages of 92.2% and 59.8% respectively.
Trend analysis of these data from 2015 to 2019 indicate that these production volumes have been quite stable over time.
Image
Figure 7.2. Comparison of food availability from local production and imports to volume requirements from the Pinggang Pinoy model
Note: Meat data is an aggregate of 4 animal and 17 fish varieties; vegetable data is an aggregate of 23 varieties; fruit data is an aggregate of 13 varieties but excludes Cavendish bananas and pineapples. Vegetable and fruits data are derived from average of trends from 2015 to 2018.
Source: FNRI (2016), PSA (2020b) and Bureau of Customs (2020).
The following sections examine the dynamics of the selected commodity chains during the COVID-19 pandemic.
Rice
In March 2020, the Department of Agriculture announced the likelihood of severe rice shortages in the latter half of 2020 due to rice export bans instituted by Vietnam and the cancellation of an order of 400,000 t earmarked for the Philippines.
In 2019, the share of imported rice to the overall supply of the country increased with the ratification of the Rice Tariffication Act (RA 11203) in response to the expired extensions on rice import volume restrictions and high inflation rates. While RA 11203 led to a significant drop in inflation, from 6.7% in September 2018 to 2.8% in September 2019 (NEDA 2019), the impact was detrimental to local farmers. Prices dropped as low as PHP8 per kg for fresh paddy (with rice production being on average 4 t/ha, the resulting gross revenue is PHP32,000 against an operating cost of PHP56,000 per ha). Fortunately, the beginning of the COVID-19 pandemic also coincided with the rice dry harvest, increasing the overall available volume of rice nationally.
The Bayanihan to Heal as One Act (RA 11469) allowed local government units to access their Calamity Funds to purchase fresh rice directly from farmers (in some cases, at a higher price than would be found at market). National agencies also purchased large volumes of rice from cooperatives and other farming groups for distribution as part of relief packages in areas with no rice production (NCR and other highly urbanised areas). These relief packages contained 2–5 kg of rice per family, and were distributed with variable frequency from March to June 2020.
The fear of rice shortages resulted in significant spikes in farming activity along the rice food commodity chains during the COVID-19 pandemic (Figure 7.3). With the resumption of rice exports from Vietnam in May 2020, and the expiration of the Bayanihan to Heal as One Act on 25 June 2020, it is not clear if high prices for local rice can be sustained as greater volumes become available. There are some suggestions that a Bayanihan 2 program may be implemented to continue and expand the activities of the Bayanihan to Heal as One Act, but there was no significant movement in legislation at the time of the assessment.
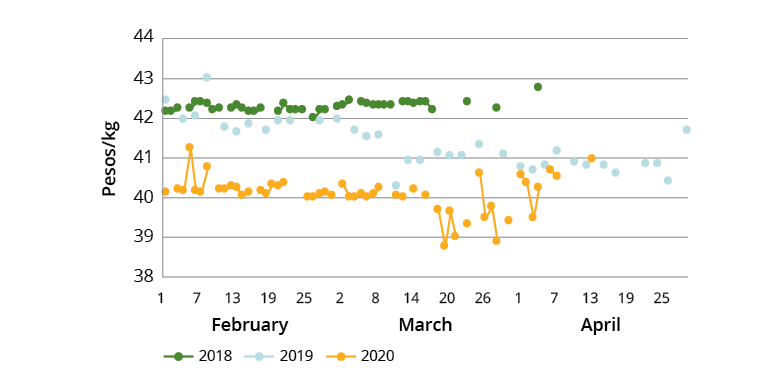
Well-milled rice, the more popularly consumed type of rice sold in the market, generally had a lower retail price in 2020 when compared to both 2018 and 2019 in the months February–April (Figure 7.3). While there is a clear increase in prices from the start of the Community Quarantine in mid-March to mid-April, the Department of Agriculture implemented a price freeze in April in order to arrest these increases.
Pork is the second most-consumed meat commodity in the NCR, with residents consuming 13.6 kg per capita per month (PSA 2017). Using estimated 2019 population data and consumption levels of pork (PSA 2017), the national requirement for pork meat is 0.962 Mt. Slaughterhouse data indicates that locally produced pork exceeds 1.9 Mt per year, exceeding the volume requirement by 98%. Despite this massive surplus, the Philippines still imported 4.5 Mt of pork meat in 2019 (Bureau of Customs 2020). Food processors use imports for up to 85% of their raw meat requirement (of pork and other meats). The stated reasons were the non-alignment between local production quality and the food processors’ technical requirements (Board of Investments 2016).
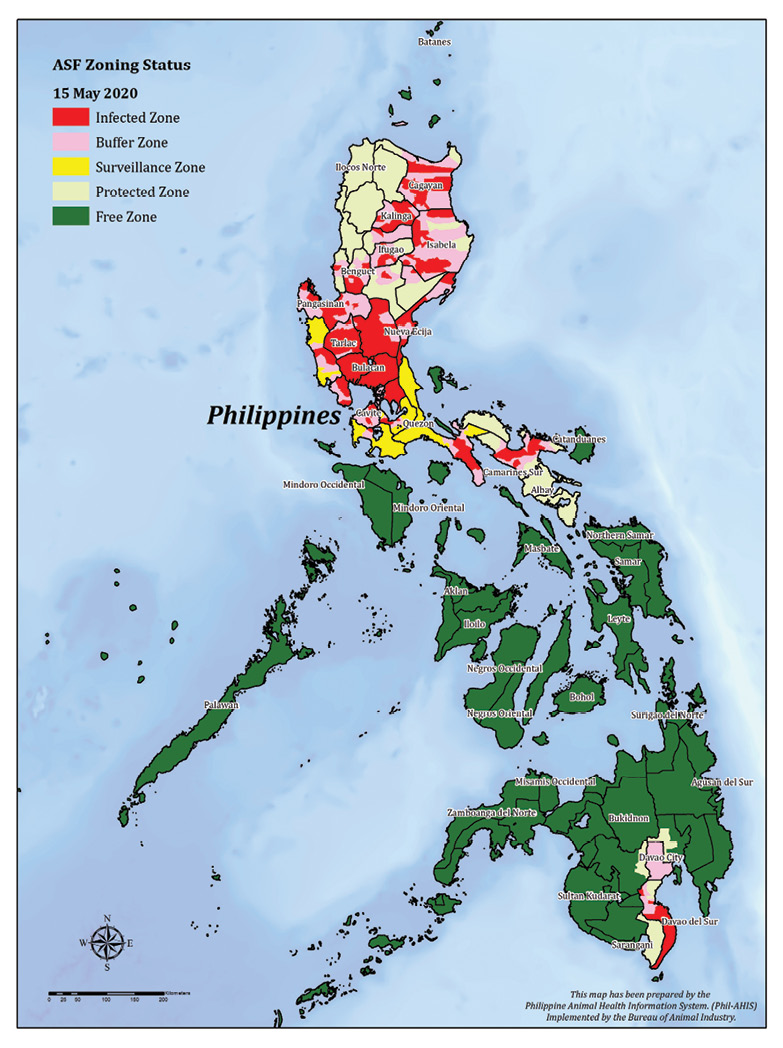
The Department of Agriculture confirmed the first outbreak of African swine fever in the Philippines in July 2019. Despite efforts to restrict the movement of livestock, infections spread to provinces north of the NCR: Bulacan, Pampanga and Nueva Ecija (Figure 7.4). By 15 May 2020, the Department of Agriculture reported the culling of 284,607 animals due to African swine fever.
Image
Figure 7.4 African swine fever zoning map (15 May 2020)
Source: Bureau of Animal Industry (2020)
Retail prices of lean pork meat were significantly lower in February 2020 than in 2019 (Figure 7.5), suggesting a reduction in demand, most likely due to erroneous fears that African swine fever is zoonotic.
Informants from the swine industry suggested that while pork meat supply from areas north of NCR has been disrupted due to African swine fever, the main source of pork meat for NCR is South Luzon, which has so far managed to maintain the spread of African swine fever.
By May 2020, Mindanao, the southernmost major island of the Philippines (and around 1,000 km south of Manila) reported an oversupply of pork meat and was earmarked as a potential source for NCR pork requirements in the coming months. However, high inter-island shipping costs (more expensive than shipping products to Hong Kong) (Dy 2017) and logistical restrictions brought about by the community quarantine make this strategy costly.
The occurrence of African swine fever has had significant impacts on both production and consumption elements of the pork value chain. As of 15 July 2020, the scale of impacts of the COVID-19 crisis have been far smaller. The travel restrictions imposed in response to the pandemic may have contributed to a slowing in the spread of African swine fever, but this has yet to be confirmed. Informants noted that pig farmers are slowly restarting their activities and estimate that the swine industry will rebound to its pre-African swine fever performance in the last quarter of 2021.
Cabbage
Cabbage is the most highly consumed highland vegetable in NCR at 2.1 kg per capita (PSA 2017); however, more affluent sections of the community consume it more frequently, with increasing consumption trends associated with Japanese, Korean and Chinese restaurants opening in the NCR.
The main source of cabbage for NCR is the Cordillera Autonomous Region, approximately 300 km north of NCR. It is estimated that this region provides approximately 26,000 t of cabbage to NCR each year, representing 42% of the total volume of cabbage brought to NCR trading posts (JICA & PwC Philippines 2019).
Farm-gate prices for cabbage in the Cordillera Autonomous Region are typically PHP20/kg (US$0.40/kg) (JICA & PwC Philippines 2019). However, in February 2020, farm-gate prices dropped to PHP4.96/kg (US$0.01/kg) due to plentiful supply and lower demand from NCR restaurants.
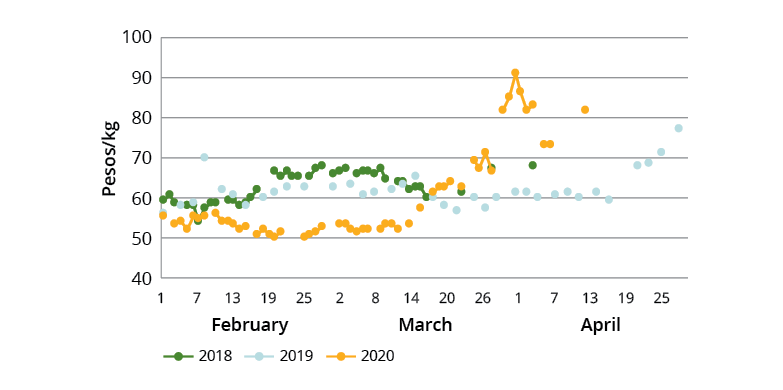
By the beginning of April, cabbage retail prices in NCR had risen to a three-year high of PHP90/kg as a result of restrictions on travel and transport (Figure 7.6).
Despite the demand for inclusion of vegetables in relief food packs, this was not uniformly applied due to difficulties of transport and distribution of these fresh goods. Informants observed farmers throwing vegetables away (including cabbage) due to a lack of demand.
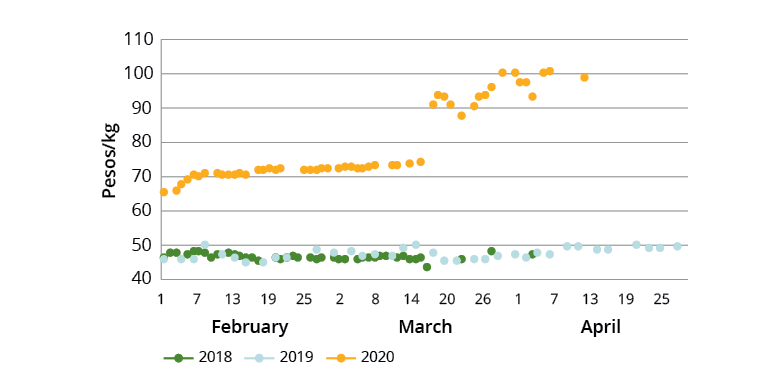
Banana is the most-consumed fruit in NCR at 12.2 kg per capita (PSA 2017). In 2019, the production of Lakatan banana was estimated at 930,000 t, covering 75% of the volume requirements of the Philippines (PSA 2020b). Of significant concern for the local banana is its high spoilage rates of up to 30% (Nuevo & Apaga 2010). For this reason, many banana grower groups also process their harvested banana into banana cake, which is typically prepared and marketed by women.
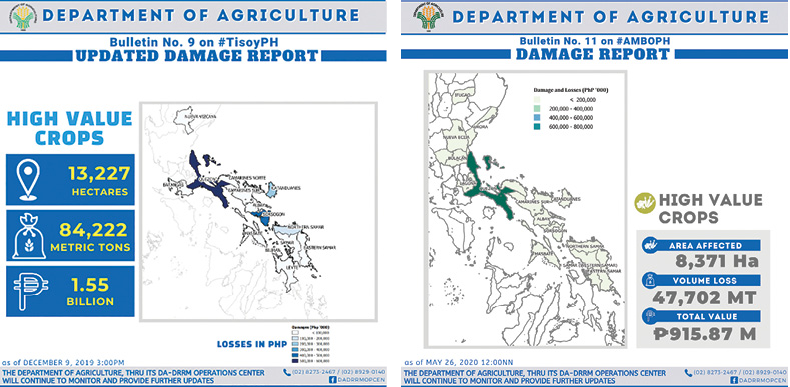
The Climate Change Commission has shown that 92% of damage to Philippine agriculture from 1990 to 2006 was attributable to climate and weather disturbances: 70% from typhoons, 18% from floods, and 4% from droughts (Llanto 2016). The Philippine Atmospheric, Geophysical and Astronomical Services Administration estimates that the country is hit by 20 tropical cyclones on average each year. On 30 November 2019, Typhoon Kammuri (locally known as Typhoon Tisoy) entered the Philippine Area of Responsibility and by 2 December 2019, the tropical cyclone was above the Southern Luzon area with maximum sustained winds of 155 km per hour and maximum gusts of 190 km per hour (PAG-ASA 2019).
Typhoon Kammuri led to significant damage to banana farms in Southern Luzon, disrupting farm and economic activities (Figure 7.7). When the COVID-19 pandemic reached the Philippines, a large portion of banana production in those areas was still in disarray.
Figure 7.7 Department of Agriculture bulletin report on Typhoon Kammuri (left) (9 December 2019) and Typhoon Vongfong (right) (16 May 2020)
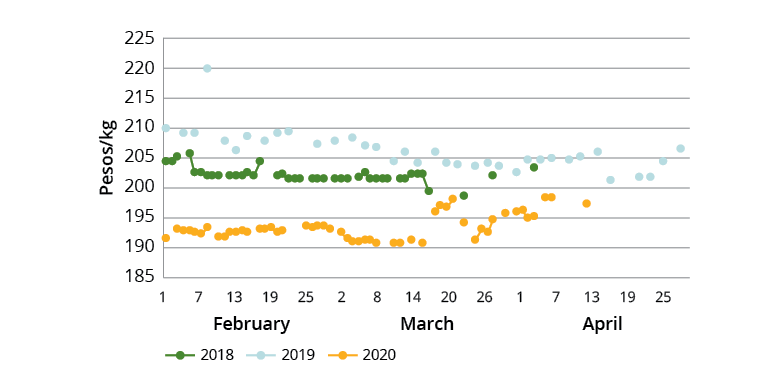
Unlike rice and pork meat, banana prices were not subject to a price freeze during community quarantine. Sharp increases in prices were observed between 14 March 2020 and 17 March 2020. This came on top of already significantly higher prices compared with 2018 and 2019 (Figure 7.8).
In mid-May 2020, Typhoon Vongfong (known locally as Ambo) made landfall over the major producing region for Lakatan bananas. Farmers shifted to other fast-growing cash crops, such as squash, in order to ensure some continuity in cash flow. Recovery efforts for these farming households are led by the Department of Agriculture and normally involve provision of subsidies for input materials.
Prior to the COVID-19 pandemic, some sectors of Philippine agriculture were already suffering production disruptions due to poor policy implementation, pests and disease spread and severe weather events.
Local enforcement of logistics restrictions creates supply chain bottlenecks
On 17 March 2020, the enhanced community quarantine came into effect in the NCR and the rest of Luzon. In addition, IATF Resolution No. 13 (17 March 2020) stated:
The [Philippine National Police] is instructed to allow the unimpeded movement of all types of cargoes, subject to its authority to conduct inspection procedures in checkpoints for the purpose of ensuring that protocols on strict home quarantine are observed.
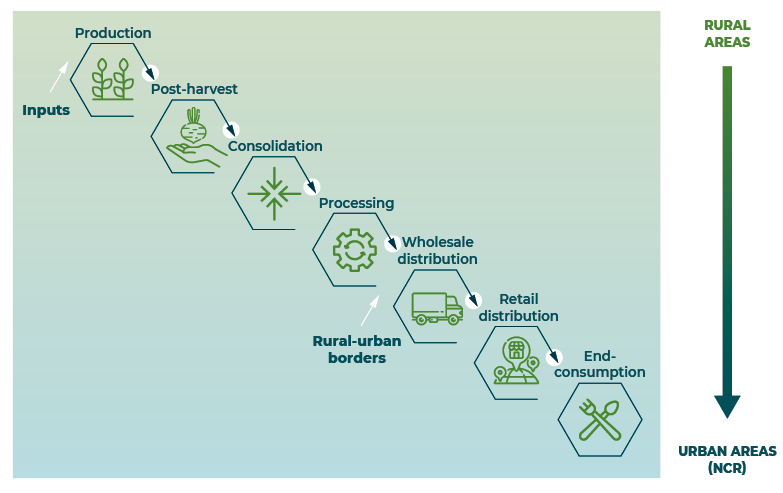
In concert with the IATF Resolution, the Department of Agriculture released an internal memorandum on ‘Implementation procedures related to Food Lane Accreditation’ to facilitate the continued distribution of agricultural commodities between rural and urban regions. It covered transport of:
…rice, perishable agricultural commodities, such as fresh fruits and vegetables, livestock and poultry, frozen meat and processed food products, feeds, fertilisers and other agricultural inputs and fishery commodities.
As of 2 April 2020, 21,177 Food Lane Passes had been distributed for Luzon alone according to the Department of Agriculture Agribusiness and Marketing Assistance Service. Despite sufficient Food Lane Passes being issued, it has been widely reported that ad hoc stoppages have disrupted the flow of food into the NCR (Figure 7.9).
A National Economic and Development Authority survey revealed that 14% of respondents reported lengthy checkpoint stoppages, despite having the required paperwork. Ineffective implementation of the passes resulted in transport interruptions and contributed to significant price volatility (Figures 7.3, 7.5, 7.6 and 7.8).
Image
Figure 7.9 Logistical bottlenecks at all parts of the supply chain, particularly for transport inputs and movement at rural–urban borders
Consumer end of food commodity chains significantly affected by community quarantine
The Philippines is a consumer-driven economy. Household final consumption comprised over 70% of gross domestic product for more than a decade, reaching 73.2% in 2019 (World Bank 2020a). Throughout these years, 40% of household final consumption was attributable to food-related expenditure (PSA 2019).
Prior to the COVID-19 pandemic, NCR residents spent US$9.3 billion each year on food expenses, capturing 18.5% of the total annual food expenditure of the country (PSA 2019). For the whole country, an estimated US$2.9 billion is spent annually on food purchased outside homes (PSA 2019), directly supporting around 40% of the 92,000 food retail establishments (PSA 2015, Rubio 2019).
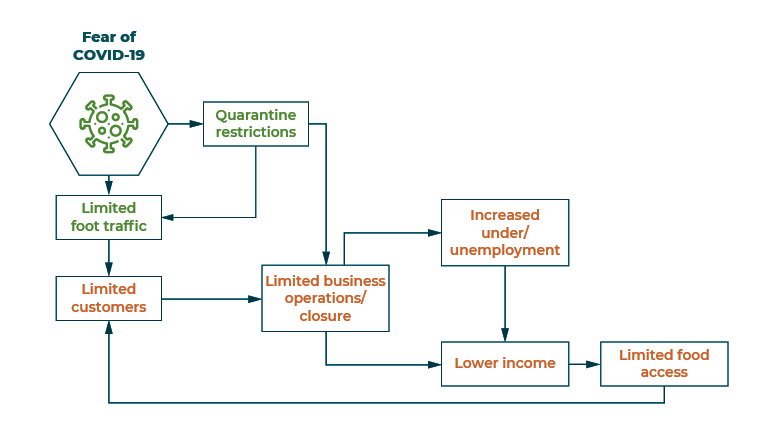
As the pandemic continued, impacts on patterns of NCR consumption changed in response to changes in employment and income. As a result of the restrictions, movement within the NCR was limited, resulting in a reduction in customer numbers, reduced purchases and consumer demand, and the closure of businesses (Figure 7.10). With business closures, unemployment rates rose rapidly, with an estimated 2.2 million workers displaced or unemployed (Inter-Agency Task Force Technical Working Group for Anticipatory and Forward Planning 2020). Significant increases in underemployment ensued, as workers were stood down.
Figure 7.10 Impact of the COVID-19 crisis on the consumer side of the food system
Unemployment and underemployment served to reduce the purchasing power of many households, with 70% reporting reduced incomes and 44% reporting insufficient income to meet basic household needs. As a result, 60% of households have reportedly reduced their food consumption with 60% of micro, small and medium-sized enterprises recording no sales between mid-March and early April 2020 and up to 75% of small and medium-sized enterprises facing closure of their businesses (Inter-Agency Task Force Technical Working Group for Anticipatory and Forward Planning 2020).
The authors estimate that, to afford the volume of foods stipulated by the Pinggang Pinoy model, a family of five would need to spend an estimated PHP14,368 (US$287) per month. Assuming complete reliance on savings from January to March 2020, it is estimated that only the top 5% (95th percentile) of NCR families have a high enough combined family income to purchase these food volumes (PSA 2019) over the next three months.
Many low-income families have become beneficiaries of the government’s Social Amelioration Program, which targeted 20 million households nationwide. The Social Amelioration Program is in addition to subsidies provided by the local government units and food packs provided by both national and local government.
It is clear is that the Social Amelioration Program will not be able to cover the basic needs of families past the end of May 2020. Food packs released by Department of Social Welfare and Development are designed to cover only two to three days per family (Official Gazette 2013).
The Department of Labor and Employment released projections indicating a decline in remittances of as much as 40%, estimated at US$13 billion for the year. This projection was based on the department’s findings that only 55% of the 345,000 overseas Filipino workers intended to stay abroad. For the remaining 45%, displacement from work and voluntary repatriation were cited among overseas Filipino workers as reasons for returning. This also contributes to the decreased purchasing power of many households dependent on remittances.
Lockdown disrupted demand and supply for women in agrifood system
Across all local industries, women account for 37.9% of total employees, comprising 15.4% upstream food commodity chains segments, 9.8% processing food commodity chains segments and 74.8% downstream food commodity chains segments (services, retail and wholesale) (PSA 2018). An estimated 2.25 million women work in agriculture, hunting and forestry, making these industries the second-largest employer of women in the Philippines (PSA 2018).
The lockdown produced an immediate contraction in the economic demand and supply that has distorted the local economy. Women in agribusiness face specific difficulties absorbing that economic shock. Some examples from informants include:
A lead farmer and 20 women farmers in her cooperative were unable to sell any produce at the market or trade with neighbouring municipalities because of local government restrictions during lockdown.
A retail store owner was unable to access store supplies and could not collect accounts owed by creditors in lockdown, impacting directly on her cash flow.
Many food stall owners in Manila (predominantly women) have been forced to close stalls, while others (including a key informant) are operating below capacity to remain open. This not only impacts on household incomes but the incomes of employees.
Women in food systems face difficulties absorbing economic shocks. With smaller cash flow and reserves, limited credit options, less inventory and a reduced (or absent) client base, women face significant challenges in returning to business as usual.
Coping strategies vary. The women farmers were able to sell some of their produce to the regional Department of Agriculture’s Kadiwa Program and worked with multiple retail sellers to distribute produce for sale. The food stall owner is operating at 30% capacity, preparing a restricted menu and catering to take-out orders but is apprehensive about the drastic drop in daily sales. The retail store owner has concentrated on fast-selling goods, such as canned goods, noodles, fresh eggs and cooking oil. She applied for a Food Lane Pass and is now able to source products from further away and to collect accounts.
There has yet to be any major COVID-19 response program designed specifically for women, and very little information, specifically relating to women has been developed or disseminated (Inter-Agency Task Force Technical Working Group for Anticipatory and Forward Planning 2020).
7.4.3 Recovery and resilience
Resilience here is defined as the ability of a food system to absorb stress while maintaining its basic structure (Allen & Prosperi 2016). A highly resilient system will have the ability to continue with minimal adjustments when facing a stressor. A system with low resilience would need a significant change in its structures in order thrive again. This section assesses the resilience of the food system components and where and how recovery might be best achieved.
High resilience among farmers and farming activities
At the beginning of the COVID-19 pandemic, informants noted that farmers just carried on farming. This was corroborated by a National Economic and Development Authority survey suggesting that 86% of farmers continued their farming activities and that 96% of farmers intend to continue or restart their farm activities in the next cropping season (Inter-Agency Task Force Technical Working Group for Anticipatory and Forward Planning 2020).
A number of factors have contributed to this continuation:
Farmers in the Philippines have built resilience over time as they face high levels of risk and frequent external shocks to their farm activities.
In general, on-farm activities are compliant with physical distancing requirements. Activities such as farmer meetings can be easily adjusted to meet these protocols.
National government agencies, local government units and development and charity organisations have purchased local produce for distribution as part of emergency food packs (driven primarily by the Bayanihan to Heal as One Act). In many cases, these new buyers have temporarily replaced distribution and retail businesses that have suspended operations due to the pandemic or community quarantine.
Suppliers of meat processors are unlikely to be severely affected by the closure of many food manufacturing and service establishments because many of these establishments relied on imported raw meat materials, which made up as much as 85% of their total volume requirement (Board of Investments 2016).
Most of the disruptions to farming activities have been related to logistical restrictions, with 35% of farmers being unable to sell their produce (Inter-Agency Task Force Technical Working Group for Anticipatory and Forward Planning 2020).
While 69% of inorganic fertilisers have been imported into the Philippines for the past two decades (Ani & Abeleda 2018), there are no clear data on the amount of inorganic fertiliser actually needed for optimal soil nutrition.
Farmers have noted difficulty accessing production inputs such as fertiliser, seed and herbicides. It seems likely that farmers and suppliers are running down existing stocks and there are suggestions that supplies are also being procured and distributed as input subsidies for farmers by local government units. This suggests that resilience is declining, and continued border restrictions could create issues for both the next cropping season and future soil fertility.
Food services in the NCR need alternative business models
Micro and small enterprises are at particular risk, as many of them have thin cash flows and lack buffers such as insurance. Informants noted that, despite this, owners still needed to compensate workers who were stood down. In acknowledgment of this stress, the government has suspended tax collection (April was the annual income tax filing month) on property rents and loan interests (Inter-Agency Task Force Technical Working Group for Anticipatory and Forward Planning 2020).
Informants observed that to maintain business operations during the pandemic and community quarantine, enterprises had to change their business models:
Restaurant owners are emphasising delivery services and marketing activities through social media or in partnership with internet-based food delivery platforms. They are also forging partnerships with vegetable growers to develop a more differentiated set of food offerings.
Variety store owners (locally known as sari-sari stores) are shifting from pure retail to including wholesale trading. This has helped establish links with suppliers (who only sell in bulk) and allows them to supply other variety stores.
Business owners are using more online options for sourcing commodities and are embracing a range of new online business opportunities.
Online shopping has significantly increased during the pandemic, with some online retail platforms claiming a 15-fold increase in transactions (ABS-CBN News 2020). Online food deliveries have become a popular mechanism for food access, which has generated much interest among international development organisations. Residents in NCR spend US$244 million per month on food purchased outside their homes, which represents one-third of total food expenses per family (PSA 2019). However, it should be noted that online services cater to a small segment of Philippine society. At close to US$2 per delivery, online delivery fees are equivalent to the cost of one person’s daily meal requirement. This is not affordable on a regular basis for most families.
The frequent shocks experienced by the agricultural communities have built resilience among farmers. However, this resilience is characterised by a risk-averse attitude that limits the adoption of high-risk, high-value farming activities and perpetuates conservative low-input farming practices.
While the majority of the farmers have continued to farm and have benefited from shorter value chains driven by government and charitable organisation procurement, these gains are likely to be temporary.
If there is a return to social isolation and travel restrictions, the significant COVID-19 crisis-related impacts being felt at the consumer end of food commodity chains is likely to move to the production side as well.
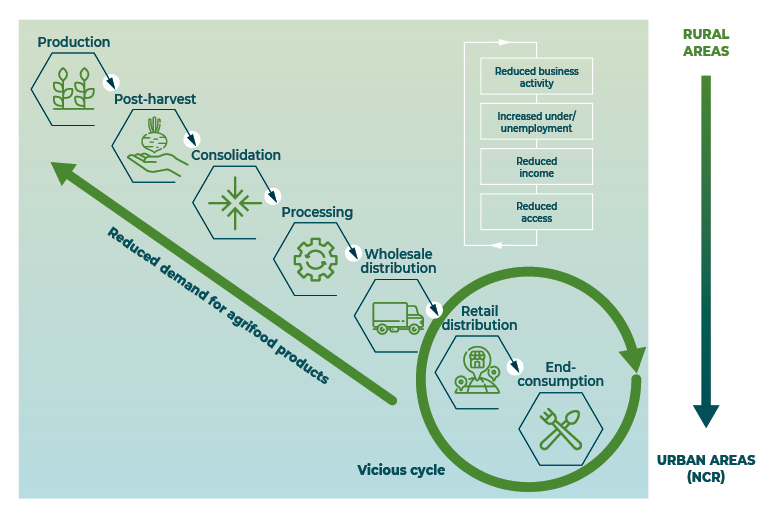
The NCR is experiencing reduced business activity resulting in increased underemployment and unemployment. This is impacting on patterns of consumption and causing reduced demand for some food commodities. This has already resulted in some localised oversupply of foods and greater price volatility (Figure 7.11).
New procurement activities from national government agencies, local government units and developmental and charitable organisations have been beneficial for farmers, and have maintained demand and commodity prices. This is not likely to persist, and when it ceases, this will result in disrupted food chain activities and suspended business operations.
Figure 7.11 Reduced access as a result of reduced business activity in the NCR will result in negative effects to production in the form of reduced demand for agrifood products
7.5 Opportunities for action
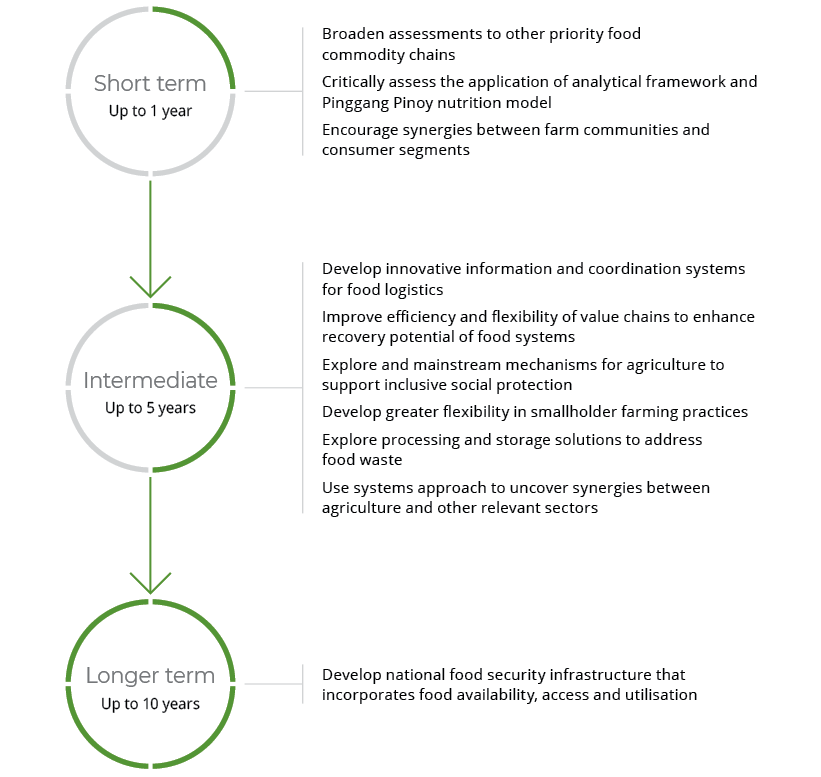
7.5.1 Snapshot of potential investment options
7.5.2 Short term (up to 1 year)
Broaden assessments to other priority food commodity chains
The current food system assessment only covers four identified food commodity chains, all of which are anchored to the NCR. Assessments covering other food commodity chains of high demand and utilisation could be conducted. These could focus on other highly urbanised areas, such as Metro Cebu in the Visayas or Metro Davao in Mindanao, or any location of interest. There is much interest in fisheries, as well as other crops of priority programs, from PCAARRD and the Department of Agriculture.
In the conduct of the current assessment, the following topics arose as worthy of further exploration:
the effects of changes in remittances and on food access among recipient households
agricultural development in the context of the COVID-19 pandemic and how multiple indicators (apart from production and economic development) will change over the next six months
food systems assessment from the perspective of vulnerable groups, such as women, children, senior citizens, people with disabilities and ethnic minorities.
Critically assess the application of the analytical framework and the Pinggang Pinoy nutrition model
The current assessment investigates food system vulnerabilities that have been particularly exposed by the COVID-19 pandemic and the community quarantine response, and the resilience and recovery potential of these food systems in the context of the COVID-19 crisis. The Food and Nutrition Research Institute’s Pinggang Pinoy model has added structure to the assessment with particular attention to food nutrition practices. To guide future assessments, an evaluation should examine the efficacy of the analytical framework used in this assessment in concert with the Pinggang Pinoy model, while also considering frameworks or food models that might better suit the demands of any future assessments.
The framing of future assessments should also focus on food security, with special emphasis on food access and food nutrition among consumers within targeted areas. This approach will support more transformative change in the food systems through improvements not just in access but also in health as a result of more nutritious diets, as opposed to merely restoring production capacities within a food system.
Encourage synergies between farm communities and consumer segments
As a large consumer-driven economy, there is an opportunity to link farm communities with co-located food industries and also to consumers. Simply producing food is not a guarantee that it will be purchased, but on-farm or co-located value adding will improve synergies between the supply and demand sides of the food commodity chains.
Exploration of alternative marketing arrangements, with two-way flows of raw materials and training, technology and markets, may be an effective model for building resilience to future shocks.
Improving consumers’ perceptions of sense of place or provenance of specific commodities may also encourage increased consumption of local produce.
The highest annual income class, with incomes of US$10,000 and over, represent only 7.6% of all Philippine families but they account for 26% of total food expenses in the country. In the NCR, they account for 28.7% of total food expenses (PSA 2019). The ability to cater to the food demands of this segment is an opportunity that needs to be maximised. Informants mentioned an increase in purchases of more nutritious but more expensive food in response to health concerns during the pandemic (in addition to the high increase in transaction volume through online retail). Nevertheless, the creation of food access channels that cater for the remaining 74% of the population, while complying with physical distancing requirements, needs to be explored quickly. The sari-sari variety stores could act as one channel, immediately jump-starting and expanding their inventory portfolios to include more nutritious food items. This could be done quickly and is immediately scalable.
7.5.3 Intermediate term (up to 5 years)
Develop innovative information and coordination systems for food logistics
One of the biggest contributors to disruptions in the food commodity chains has been logistical and temporary trade restrictions. While the national government endeavoured to ensure unrestricted food logistics, implementation and real-time monitoring among national agencies and local government units was poorly coordinated. Better monitoring and evaluation approaches and commodity tracing are needed to improve implementation and maintenance.
Various technologies are now available to national agencies and local government units, and fast information exchange can be readily achieved. However, training in communications is needed to ensure that messages are well articulated and fully understood by all supply chain stakeholders. For information dissemination to be more effective, the legal language used in official memoranda will need to be simplified and coupled with other critical information drawn from a broad range of sources.
Improve efficiency and flexibility of value chains to enhance recovery potential of food systems
The recovery potential of a food system is strongly dependent on the efficiencies of value chains within that system. Increased efficiency comes about when value-chain actors and agencies in their enabling environment work together effectively. The best-case scenario is when these stakeholders work together in real time to solve problems that stifle the movement of food commodities from the supplier to consumers.
This may require an immediate adjustment such as shortening chains by removing intermediaries in the supply chain, selling to local markets or choosing logistical routes that provide low travel and/or paths of least sociopolitical resistance. Mechanisms like these are found in non-political, national platforms like Grow Asia’s Philippines Partnership for Sustainable Agriculture, which coordinates public, private and development sectors and farm groups to increase value-chain efficiencies. Assessing such platforms to develop improved and scaled-up models may provide a sustainable way to improve value-chain efficiencies in the Philippines.
Explore and mainstream mechanisms for agriculture to support inclusive social protection
The role and performance of agricultural communities has been placed in the spotlight with the looming COVID-19-induced food crisis. Immediately, agricultural communities involved in food (especially staples) were tapped to produce and ultimately bring food to low-income, local communities and the urban poor. These measures addressed immediate food access problems. The ways that agriculture has been used for social protection should be explored further to improve the mechanics of such programs, understand how to mainstream these activities as part of disaster risk management protocols and understand how stakeholders other than government can contribute to the development and implementation of more sustainable systems. Insurance and guarantee mechanisms, along with relevant business models, should be explored to inform the development of a robust, readily available and accessible mechanism against future shocks, whether acute or longstanding like the COVID-19 pandemic.
Social protection innovation is needed that leads to more inclusive outcomes (meeting the needs of vulnerable groups such as women, children and low-income farmers), better nutritional levels for all groups and sustainable and resilient agricultural systems. Such social protection designs could use technology (for example, higher quality agricultural inputs and new ways of enhancing credit access) and involve multi-stakeholder engagements (rather than being driven solely by government).
Develop greater flexibility in smallholder farming practices
In this assessment, farm producers have demonstrated their resilience against shocks like the COVID-19 pandemic. However, this is also attributable to risk aversion, which prevents these producers from engaging in high-risk, high-value agricultural practices. Risk aversion is associated with the high prevalence of rural poverty, itself a longstanding vulnerability in the food system. The low income associated with traditional agricultural practices limits participation of local farms in high-demand markets (such as food processing) and the engagement of youth in agriculture. Transformational changes must be sought, rather than efforts that are designed to return farm producers to their previous (suboptimal) state.
Transformational changes may be achieved by increasing the level of flexibility smallholder farmers have around their agricultural practices. This will allow them to change and adjust quickly in response to market demands while also retaining the ability to bounce back quickly after being hit by external shocks. A flexible farm system could be characterised as having increased diversification of high-value food products (achieved through intercropping, companion planting and other multi-product models) and adoption of technology and innovation. While each high-value product would carry higher risk, the distribution of risk across multiple products would mean lower overall risk. Risk may be further mitigated with the introduction of buffer mechanisms such as insurance and guarantees. Studying where and under what contexts such models are being implemented appropriately could improve the likelihood of success for these alternative farm production models.
It is recommended that a more in-depth examination of barriers to adoption of these flexible models and technologies be undertaken to better understand their underpinnings (personal, cultural, etc.) and identify measures to address barriers. Activities involving behavioural and attitudinal changes should be explored, along with ways of underwriting communities and/or agribusinesses that are testing new technologies.
One challenge is exploring new ways to deliver agricultural extension outside local government services. Care must be taken to make these service-delivery mechanisms appropriate to the community context and in keeping with health-related protocols that are designed to prevent COVID-19 spread (such as physical distancing, remote learning, e-extension programs).
Explore processing and storage solutions to address food waste
Despite the looming food crisis, a large amount of food has been discarded. Although primarily due to lack of access to markets, food consumption preferences also played a role. In response, the Department of Agriculture identified points of high food wastage with the aim of setting up food-processing facilities and storage to prolong the shelf life of these food commodities. More information on the value chains of perishable food commodities—often high-nutrition foods—is needed in order to match demand requirements (volume and technical requirements) against production practices. Value-chain information such as this may help develop circular economy models where food wastes can be processed and delivered as inputs for another chain (for example, crop food wastes used as animal feed, and animal wastes used as inputs for crop farming).
Use systems approach to uncover synergies between agriculture and other relevant sectors
Taking a whole-of-system perspective may reveal possible synergies with areas not typically associated with agriculture. For example, movements like One Health look at biosecurity as combining environmental factors, human health and animal health. Many of the safety protocols designed for COVID-19 are similar to biosecurity protocols for preventing the spread of African swine fever. This presents synergies that may open up more opportunities for synergy and resource access than when these issues are addressed in silos.
7.5.4 Longer term (up to 10 years)
Develop national food security infrastructure that incorporates food availability, access and utilisation
The National Food Authority was originally designed to manage the whole country’s food security requirements. The National Food Authority now focuses on ensuring a buffer of rice stocks. Informants suggest that many National Food Authority warehouses, which are strategically located to maximise reach to populated areas, are underutilised. These warehouses could be used for buffer stocks of food items in addition to rice, such as meat products, vegetables and fruit. This would require these warehouses to be equipped with appropriate cold storage facilities, as well as protocols for the disposal and replenishment of stocks to effectively manage spoilage.
The operations of these food depots should already be informed by the main pillars of food security—not just availability and accessibility, but also utilisation. Food nutrition—whether based on the simplified Pinggang Pinoy model or a more in-depth dietary plan—should be at the heart of food depot models in order to ensure sufficient nutritious food for the population, even during longstanding crises such as a pandemic.
7.6 Conclusions
The Philippines assessment was a rapid and focused approach to illustrate the growing impacts of the COVID-19 crisis on the food system of a country that is already one of the most hazard-prone in the world. The value-chain approach used in the assessment provided an opportunity to explore both production constraints and vulnerabilities, and critical supply chain disruptions in terms of food demand and consumption.
Strong engagement with relevant in-country agencies helped align the selection of commodities with priority research and development programs, as well as national nutrition targets. Demonstration of the analytical framework provides a platform to expand understanding of impacted food systems dynamics to other commodities, regions and supply chain complexity.
Four key themes emerged from the assessment:
At the time of the assessment, other external drivers (for example, climate factors, pests and diseases) were playing a more significant role in food availability across the four food commodity chains than COVID-19.
Local enforcement of transport restrictions is creating supply-chain bottlenecks, particularly for production inputs and produce distribution.
Consumer and retail components of the food commodity chains have been significantly affected by enforced community quarantine and restricted logistics.
Despite the large number of women engaged along these food commodity chains, there has been no targeted response designed to support them, particularly in the processing and retail segments.
These findings and others suggest a range of research and investment opportunities across the three study time frames. In the shorter-term, opportunities include:
additional focus on priority food commodity chains, vulnerable societal groups and geographies
linking producers to consumers through alternative distribution and marketing mechanisms.
In the intermediate-term, opportunities include:
improved information management and coordination systems for food logistics
supporting food system recovery through improved efficiency, coordination and flexibility across value chains, including smallholders
finding ways for agriculture to support inclusive social protection and to better mitigate food waste.
In the longer-term, there is an opportunity to develop national infrastructure to better equip the country for future food crises, that incorporates multiple aspects of food security, including food availability, access and utilisation.
Allen T & Prosperi P (2016). Modelling sustainable food systems. Environmental Management 57:956–975.
Ani PB & Abeleda MF (2018). Towards a more productive agriculture. A review of the policies affecting the Philippine fertilizer industry. Food and Fertilizer Technology Center for the Asia and the Pacific Region, accessed 2 June 2020, http://ap.fftc.agnet.org/ap_db.php?id=895
Inter-Agency Task Force Technical Working Group for Anticipatory and Forward Planning (29 May 2020). NEDA ‘We recover as one’ report details road to new normal, National Economic and Development Authority, Philippines, accessed 15 June 2020.
JICA & PwC Philippines (Japan International Cooperation Agency & PwC Philippines) (2019). Survey on issue analysis of food value chain in the Philippines, JICA report, Philippines, accessed 1 June 2020, https://openjicareport.jica.go.jp/pdf/1000041342.pdf
Llanto GM (2016). Risks, shocks, building resilience: Philippines. Philippine Institute for Development Studies, accessed 3 June 2020, https://dirp3.pids.gov.ph/websitecms/CDN/PUBLICATIONS/pidsdps1609_rev.pdf
NEDA (National Economic and Development Authority) (2019). Rice Tariffication Law proves it is beneficial, media release, NEDA, Pasig City, Philippines, 4 October 2019.
Nuevo PA & Apaga AR (2010). Technology reducing postharvest losses and maintaining quality of fruits and vegetables (Philippines). 2010 AARDO workshop on technology on reducing post-harvest losses and maintain quality of fruits and vegetables, 154–167, accessed 1 June 12020.
PSA (Philippine Statistics Authority) (2017). Consumption of selected agricultural commodities in the Philippines, volume 1—national and regional, PSA, Philippines, accessed 2 June 2020, https://psa.gov.ph/content/consumption-selected-agricultural-commodities-philippines
PSA (Philippine Statistics Authority) (2019). 2018 family income and expenditure survey, PSA, 4 December 2019, accessed 1 June 2020, www.psa.gov.ph/content/annual-family-income-estimated-php-313-thousand-average-2018
PSA (Philippine Statistics Authority) (2020a). Updated 2015 and 2018 full year official poverty statistics, PSA, 4 June 2020, accessed June 15 2020, https://psa.gov.ph/poverty-press-releases/nid/162559